Seasonality in the Crack Spread
March 29th, 2011
Some Background
For those of us who are not involved in the energy trade, the ‘crack spread’ can be a bit of a mystery, however I will endeavor today to illuminate this very important corner of the oil market. The crack spread represents the profit that an oil refinery can make by ‘cracking’ a barrel of oil into refined products, specifically gasoline and heating oil. While there are many different ratios and incarnations of this spread, the most commonly quoted and widely watched is the 3:2:1 spread. The 3:2:1 represents three contracts of crude oil, against 2 contracts of gasoline and 1 contract of heating oil. This ratio roughly characterizes the output from refining crude oil. When one is referred to as having bought the crack spread, it means they have sold 3 contracts of crude oil and purchased 2 contracts of gasoline (RBOB) and 1 contract of heating oil, in hopes that the prices of the refined products will gain on that of crude oil. Conversely, being short the crack spread would mean buying crude and selling the products.
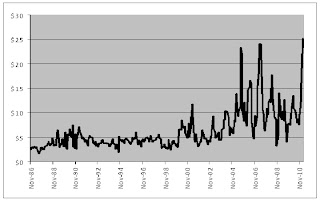
Since last fall, the crack spread has risen materially, and in absolute terms recently made a new all-time high of over $25 per barrel (see chart).
3:2:1 Crack Spread
Courtesy of Bloomberg
The Seasonality of Refined Products
The general rule of thumb when it comes to the seasonality of the refined products is that heating oil is strong in the winter months, when demand rises in response to cold weather, and gasoline is strong in the spring/summer months when more people ‘hit the road’ boosting demand for the fuel. This seasonality is clearly demonstrated in the forward curve for RBOB gasoline futures (see chart), with higher prices seen in the summer months.
Forward Curve of RBOB Gasoline
Courtesy of Bloomberg
Spread Between RBOB Gasoline and Heating Oil
Courtesy of Bloomberg
As the chart above demonstrates, (with the exception of 2008) gasoline generally trades at a premium to heating oil starting somewhere around February or March, and trades at a discount sometime towards the end of the summer. Currently the two products are trading at nearly the same price, and the trend is in favour of the RBOB, as would be expected based on historical seasonality.
-Jaime Macrae, CIM
Account Executive, Friedberg Mercantile Group
jmacrae@friedberg.ca


Hi Jamie,
ReplyDeleteim new to futures trading just had a litte question for you
Could you clarify mathematically how the spread is calculated if you long the the crack? Just to make sure my calc is right for the november 11 spread i came to a spread of 28.5...
cheers
Tarak,
ReplyDeleteThere are several different crack spreads that can be calculated. The most common, which I mentioned in my post, is the 3:2:1 spread. If you are long, that means you have sold 3 crude, and have bought 2 rbob gasoline, and 1 heating oil. To express this mathematically, first you must reconcile the quotes between the products (which are priced in dollars per gallon), with the price of crude per barrel. There are 42 gallons in a barrel, so simply multiply the price of heat and rbob by 42 to get the per barrel price. After you've done that the mathematical expression is as follows:
{[(2 * RBOB)+ (1 * Heating Oil)]-(3 * Crude Oil)}/3 = per barrel spread
At current prices the front month (May) spread works out to be:
{[(2 * 128.11 rbob) + (128.30 heat)] - (3 * 104.09 crude)} / 3 = $24.08
Currently the November 321 crack is around $16, so I'm not sure what prices you were using.
Hope this helps,
Jaime
Thanks for clearing that up Jamie. I wasnt multiplying the gas and HO by 42 hence the reason I was off..
ReplyDeleteInteresting blog by the way!