Friday, April 29, 2011

U.S. Government Debt, the Decline of Fiat Currencies, Gold and the Fed - Apr 29th

U.S. Government Debt, the Decline of Fiat Currencies, Gold and the Fed
April 29th, 2011


The USD against Other Currencies

The U.S. dollar has been falling precipitously against virtually every major currency around the world.  Sentiment is reaching extremely low levels, and based on the CFTC’s Commitment of Traders report, speculators are short of the greenback in every major pair, with the exception of the Japanese yen.  Below is a chart of the net USD position of large non-commercial traders (typically interpreted to represent the positions of large hedge funds and trading desks), overlaid against the U.S. Dollar Index.

U.S. Dollar Index and Net Large Speculative Positions
Courtesy of Bloomberg

During this week’s post FOMC press conference, the first of its kind, Fed Chairman Ben Bernanke was asked about the Fed’s stance on falling U.S. dollar.  He was very clear that the Fed believes that a strong dollar is in the nation’s best interest.  If he believed what he was saying, it seems no one else did, as the U.S. dollar proceeded to make new lows. 

The U.S. Dollar against Non-Fiat Stores of Value

It is always important to remember that when we look at currency values, it is always relative to another currency, but how are fiat currencies doing in general when measured against some other tangible store of value.  The obvious example are the precious metals, and more specifically gold.  Gold has been rising steadily, making new all-time highs on 14 days in April.  Some might argue that gold is not money, but tell that to Utah, where legislation was recently passed that made gold legal tender.  The trend is up against every major currency, though it has not been making new highs against all of them.  Most notably, in term of the Australian dollar, gold has not surpassed the high made in 2010, nor its all-time high made in 2009.  Below is a comparison of the yellow metal in USD vs. Aussie over the past few years.

Gold in USD and Aussie
Courtesy of Bloomberg

Inflation

If you were to listen to Bernanke, the only thing pushing inflation higher is the rising gasoline price at the pump, which is the result not of a weakening U.S. dollar and overly accommodative monetary policy, but outside geo-political events in the Middle East and North Africa.  Let’s turn instead to reality.  Over the past 12 months, virtually every commodity has seen significant gains, with few exceptions.  The prices of raw material are highly sensitive to excess money creation, and are a fantastic leading indicator of current and future inflation.  This is not “transitory” as some would like us to believe. 

To the Point:  U.S. Government Debt

Given that the U.S. dollar is in decline, and inflation is on the rise, why are investors willing to lend money to the U.S. government for 30 years for a paltry yield of around 4.4 percent?  The answer is pretty easy to understand:  the Fed is holding long-term yields down artificially by maintaining ultra-loose monetary policy, effectively tethering bond yields to the overnight rate.  The mechanism that facilitates this is a simple carry trade.  Borrow from the Fed for what amounts to next to nothing, and invest the proceeds in higher yielding government debt.  And who says quantitative easing is about to end…

-Jaime Macrae, CIM
Account Executive, Friedberg Mercantile Group
jmacrae@friedberg.ca

Thursday, April 28, 2011

Corn, Beans, Wheat, and Mother Nature - Apr 28th

Corn, Beans, Spring Wheat, and Mother Nature
April 28th, 2011


Farmers across the eastern and southern Midwest and the Delta regions are struggling to get their crops planted, facing persistent rains and cold soil temperatures.  The important growing regions in the Midwest are forecast to experience severe flooding until May 2nd, and this is reflected in the slow progress being made in the fields.  As of the last USDA Planting Progress report, released on April 24th, only 9 percent of the corn crop has been seeded, compared to 46 percent last year and the ten-year average of 23 percent for this time of year.  Only 6 percent of the spring wheat crop has made it into the ground, compared to 39 percent last year and a ten-year average of 27 percent.  A friend recently forwarded some photos of the flooding, and I will share one of them here today. 


The rains have not been bullish for all crops, as it has spread somewhat to the parched winter wheat growing regions in the South, helping to push wheat futures down sharply in yesterday’s session. 

Cold Soil Temperatures

Underneath the soaked fields, the soil is very cold, currently about 10 degrees cooler than usual in the important corn growing state of Iowa.  Soil temperature is a critical determinant of crop germination, with corn refusing to grow in soil below 50 degrees (Fahrenheit).  Soybeans that are exposed to temperatures less than 28 degrees (2 below in Celsius) need to be replanted.  Forecasts call for temperatures to drop below freezing twice next week in the upper Great Plains, and the cold may spread to northwestern Iowa and Wisconsin.  This is bad news for field crops, as we are in the prime planting period for corn and spring wheat.  To achieve optimal yields in Iowa for example, corn needs to be planted by May 2nd, and as a general rule, corn planted after May 15th will risk lower yields.  Should planting delays persist for much longer, it could lead farmers to switch to soybeans, though we should keep in mind that with modern farm technology; a lot can be accomplished in a short period of time. 

-Jaime Macrae, CIM
Account Executive, Friedberg Mercantile Group
jmacrae@friedberg.ca

Thursday, April 21, 2011

The Cable Breaks Out - Apr 21st

The Cable Breaks Out
April 21st, 2011


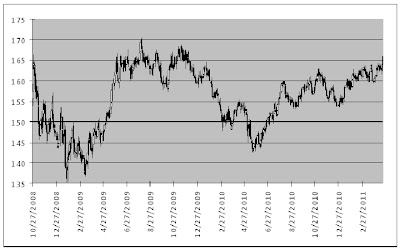
The British Pound Sterling soared higher this morning, building on a three-day rally, and has reached the highest level since the beginning of December 2009.  Today’s move, currently up 1.73 to 165.70 basis June futures, was sparked in part by a broadly weaker USD, as well as Retail Sales that beat analysts expectations across the board (see chart)

British Pound Futures
Courtesy of Bloomberg

Economic Slump

The UK has been dogged by weak economic data, and high inflation, making it hard for the central bank to raise interest rates from the record low 0.50%.  Looking back over April, the month kicked-off with a drop in the PMI Manufacturing survey to 57.1 from 61.5 the month prior.  By contrast, the Services sector showed some improvement, rising to 57.1 from 52.6.  Construction pretty much stayed the same, 56.4 from 56.5, but did manage to beat the markets expectation for a decline to 54.8.  A few days later, Industrial and Manufacturing Production provided yet another disappointment, with the former contracting (-1.2% m/m from 0.5%), and the latter showing no growth, down from a 1% rise the month before.

Inflation, which was released a week later on the 12th, did come in below expectations, but still rather high nonetheless.  Year over year, headline CPI rose 4%, and Core CPI rose 3.2%.  The Bank of England has only one mandate, stable prices, but raising rates to tame inflation doesn’t seem to sit well with the Monetary Policy Committee who voted 6-3 in favour of leaving rates unchanged.  The ensuing statement said, “An increase in [the] bank rate in current circumstances could adversely affect consumer confidence, leading to an exaggerated impact on spending”, as well as citing a “significant risk” that inflation could rise above 5%.

The picture got no rosier last week, with Jobless Claims rising unexpectedly, up 0.7K when analysts were looking for a 3.0K decline, on the heels of a sizeable 8.5K decline the month earlier. 

On Deck

All eyes will be on the quarterly GDP number to be released on the 27th, which will likely solidify analysts expectations for the Bank of England’s action at next month’s MPC meeting on May 5th.  A survey of expectations shows that a small majority of analysts expect a hike in the second quarter. 

Monday, April 18, 2011

Copper(Top) Heavy - Apr 18th

Copper(Top) Heavy
April 18th, 2011


Copper prices have been sliding thus far in 2011, and the outlook for higher prices is murky at best.  While there are some bullish factors at play; a weaker U.S. dollar, projected supply deficit, and a lack of new mine production coming on-stream (not to mention declining ore quality), the bear camp may be gaining control of the market.

China:  The Elephant in the Room

As with many commodity markets, Chinese demand is a huge driver of copper prices, and will be the focus of today’s post.  Last year, usage of refined copper grew by around 7 percent worldwide to about 19.4 million tonnes, though the apparent growth in Chinese use was more modest at 4.3 percent.  This compares to 2009, when copper use grew by around 37 percent, helping push prices to what were then all-time highs.  Back in 2009, the market had a 175,000 tonne surplus, which turned into a 305,000 tonne deficit last year.  Chinese buying has slowed so far in 2011, falling 15.6 percent in the first quarter, according to customs data.  They are also moving aggressively to curtail growth on several fronts.

-Reserve Ratios

China has embarked on path of higher and higher reserve ratios, the percentage of deposits a bank must hold rather than lend out.  They announced last night that once again reserve ratios will increase, this time to a record 20.5 percent.  The Chinese central government is obviously intent of slowing down growth and inflation, which continue to beat expectations. 

-Metal Specific Growth Limits

As part of its 12th five-year plan, China announced that it will limit the expansion of nonferrous metals production to 8 percent per annum, as well as increase recycling efforts.  China produced 6.33 million tonnes of recycled copper, aluminum, and lead in 2009, and the plan would see that number grow to 12 million tonnes by 2015. 

-Crackdown on “Inventory Financing”

It has been a closely watched, though often not heavily covered, carry trade taking place in China, and apparently not confined to the copper market.  Chinese traders have been buying copper using 180 letters of credit from Chinese banks; these loans do not get repaid for 180 days after the copper is delivered.  In the meantime, traders will use the copper, stored in bonded warehouses, as collateral to obtain a loan, less a small haircut akin to a margin requirement.  The proceeds from the loan are then used to buy higher yielding assets.  This carry trade has led to a buildup of supplies in China, some estimate as much as 600,000 tonnes. 

While this type of transaction is technically ‘legal’, Chinese law dictates that the loan proceeds are not used for investment purposes, though this seems to be largely ignored by the trading community.  In order to crackdown on the practice, the Chinese government has introduced new rules surrounding the trade.  Without getting into the specifics, the new rules require traders to complete the contracts (i.e. make or take delivery) prior to using the proceeds.  It also reduces the amount of copper traders can buy/sell with deferred payment schedules, and imposes restrictions on converting foreign currency from these transaction to renminbi.  The goal is to reduce the number of traders who buy copper solely as a source of financing.  Without these transactions, apparent Chinese demand could be substantially reduced.  It is worth noting however, that it is as yet unclear how effective the new regulations will be. 

-Jaime Macrae, CIM
Account Executive, Friedberg Mercantile Group
jmacrae@friedberg.ca

Friday, April 15, 2011

Everybody's Talking About Silver - Apr 15th

Everybody’s Talking About Silver, and That’s The Problem
April 15th, 2011


It seems that silver makes a new multi-decade high everyday, and whenever I ‘talk commodities’ with someone new, invariably the question is asked, “What is going on with the silver market, and is it too late to get in?”  Despite the incredible returns that a long silver position would have yielded over the past year (prices are up a whopping 162% over the past 12 months), my typical response has been that it is investment demand pushing it up, and the volatility is so great that I simply cannot participate, preferring the more subdued gold market to fulfill my precious metals appetite.  That said, I feel compelled to take a closer look at the fundamentals of the silver market this morning, and would like to start off by thanking GMFS for its World Silver Survey released last week.

Production and Other Supply

There is certainly no shortage of silver supply; in fact 1,056.8 million ounces hit the market in 2010, up 14.6 percent from the year earlier.  Of that, around 70 percent came from mines - in other words, new silver.  The next largest source was from scrap, representing around 20 percent, which increase 14 percent in 2010 to a record of 215 million ounces.  The most notable source of silver supply came from producer hedging.  After 4 years of de-hedging that left the global hedge book at a 2 decade low, producers were quick to take advantage of rising prices by forward selling 61.1 million ounces of silver, mostly in the fourth quarter of last year.  Precious metals hedging had fallen out of favour among mine operators in recent years, as prices have been steadily appreciating.  The re-emergence of this activity may indicate that commercial producers view these prices as unsustainably high, or at least high enough to satisfy their needs.  Lastly, Russia sold around 40 million ounces from its stockpiles, the only significant sale from a government source.

Fabrication Demand

After suffering a big hit in 2009 following the global economic contraction, fabrication demand rebounded significantly in 2010, rising to 487.4 million ounces and is now just shy of pre-crisis levels.  Photography, once one of the main drivers of demand for the metal, has shifted largely towards digital technology, and at the same time reduced the use of silver for film by 66 percent since 2001.  Declining demand from the photography sector is often used to paint a bearish picture of the fabrication demand for silver, but in reality over the same timeframe demand from industrial applications has picked up nearly all of the slack.  One of the fastest growing segments of the industrial sector, which makes up 55 percent of fabrication demand, is the construction of photovoltaic solar panels.  Given the increasing focus of ‘green’ energy, it is probably safe to assume this will continue to consume greater quantities of silver in years to come.  All told the demand from industrial applications increased by about 80 million ounces in 2010.  The other area that experienced growth was the coin and medal sector, which consumed an additional 20 million ounces last year.

Investment Demand

Total investment demand exploded to the upside last year, estimated at around 180 million ounces.  Bullion stocks around the world continue to swell, driven largely by the holding of the major physically backed silver ETFs.  It seems clear that more than any other factor, investor demand to hold precious metals is pushing this market higher, and this could continue for some time.  Don’t be fooled however, into thinking that there isn’t enough silver to go around, as this is simply not true.  Last year was the third year in a row where the market was in a surplus, and that could easily continue into this year.  Tread carefully.

-Jaime Macrae, CIM
Account Executive, Friedberg Mercantile Group
jmacrae@friedberg.ca
Thursday, April 14, 2011

Global Recovery in Sugar Production - Apr 14th

Global Recovery in Sugar Production
April 14th, 2011


Sugar has been the worst performing commodity so far in 2011, and this morning fell to a six-month low.  Despite the weakness, it is still very expensive from an historical perspective (see chart).  The last few years have seen huge price increases as the world’s supply fell into two consecutive years of deficit, the deficit in 2008 being particularly severe leading to a significant draw from stockpiles of over 11 million metric tonnes.  The last time that sugar prices pushed above $0.20 per pound (aside from the past couple of years), was in 1980.

Long-Term Sugar Prices
Courtesy of Bloomberg

A Little Bit of Background

The two most significant producers of sugar cane are Brazil, the top producer and source of around 25 percent of global production, and India, which produces around 16 percent of the world’s sugar. 

Brazil has leveraged its wealth of sugar to transform its energy sector and create the world’s most developed ethanol market.  The government requires all gasoline to contain at least 25% ethanol, and most cars can run on 100% ethanol.  As a result, most of their sugar crop goes to ethanol production, with the current split estimated to be between 45-47% sugar and 53-55% ethanol. 

India, which usually produces enough sugar cane to meet its domestic demand, became a net importer in the 2008/09 season when drought significantly reduced its crop.  The situation got slightly better the next year, but it was still unable to produce enough sugar to satisfy its own needs.  This year however, production has rebounded and it is has once again began to export small quantities to the world market.

High Prices Make Great Fertilizer

The three decade high in sugar prices spurred producers to ramp up production this year, and large crops are expected from India, which increased acreage by 5 percent, and Thailand, which boosted production by as much as 13 percent from last year.  All told, global supplies remain very tight, and the stocks-use ratio is currently at the lowest level in at least 30 years, at roughly 16.5%.  The outlook is improving however, and barring significant problems with the Brazilian harvest (which is currently being delayed due to unusually wet weather), there appears to be few risks that could push the market to new highs. 

-Jaime Macrae, CIM
Account Executive, Friedberg Mercantile Group
jmacrae@friedberg.ca


Wednesday, April 13, 2011

Speculation in the Coffee Market - Apr 13th

Speculation in the Coffee Market
Concepts in Futures Trading
April 13th, 2011


Coffee continues to outperform most other commodities, holding up relatively well during yesterday’s broad selloff, and leading the pack to the upside this morning.  This rally is supported on many fronts; increasing demand from emerging economies, declining stockpiles, and a weakening U.S. dollar.  As will be discussed below, there is room for this uptrend to continue going forward.

July Coffee Futures – ICE
Courtesy of Bloomberg

Declining Inventories and Ending Stocks

Closely watched ICE warehouse stocks, those deliverable against Arabica futures, have been on the decline for 29 consecutive months, and are now about a third of what they were in the fall of 2008 when they began to fall.  World ending stocks have been trending lower since 2002.  Generally, the world coffee market alternates between years of surplus and years of deficit, due to the bi-annual coffee crop cycle.  Coffee yields vary from year to year, producing more beans one year, and less the following year.  This past season was the good crop, meaning the 2011/12 crop will be smaller, and significantly so.  While coffee production worldwide is steadily increasing, it has not kept pace with rising demand from growing economies.  Brazil, the world’s top producer, is now the third largest consumer, after the EU and the U.S.  The trouble with coffee, unlike some other agricultural commodities, is that it takes years to develop new growing areas, so production cannot quickly respond to rising prices.  That is the fundamental backdrop, but today’s blog is about another aspect of the coffee market:  Speculators.

CFTC Commitment of Traders

One of the things that commodity traders watch closely is the weekly Commitment of Traders report released by the CFTC.  Traders who take positions exceeding reporting limits, set individually by the CFTC for each particular market, must report their holdings.  This information is made public each week, and gives traders a clear indication of who is buying and who is selling.  The group that is of most interest is the Non-Commercial Large traders, usually interpreted to represent the large speculative community of CTAs and other hedge funds.  This group is viewed as a good indication of the sentiment of the speculators trading the market.  Below is a chart of the net position of this category of traders, overlaid against the price of coffee.

CFTC Large Non-Commercial Traders, Net Position
Courtesy of Bloomberg

The chart shows that large speculators amassed a sizeable long position in this market during the summer of 2010, and have been liquidating their positions throughout 2011.  During the liquidation, coffee prices have held up, and have actually risen over 16 percent.  This is often construed as a bullish development, as the market continues to strengthen despite shifting sentiment and selling pressure.  In this situation, those traders that focus on sentiment will anticipate the speculative community will turn bullish once again, realizing they exited the trade too early, and push the market up further with renewed buying. 

I present this chart to illustrate a concept, not to recommend a specific trade.  Stay tuned to Futures Commentary for a follow-up discussion once this divergence of sentiment and price action resolves itself.

-Jaime Macrae, CIM
Account Executive, Friedberg Mercantile Group
jmacrae@friedberg.ca

Tuesday, April 12, 2011

The Canadian Dollar - Apr 12th

The Canadian Dollar
A Picture (Chart) is Worth a Thousand Words
April 12th, 2011


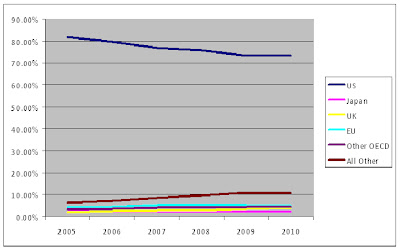
Today’s discussion will more closely resemble a picture show than an essay.  The Bank of Canada decided this morning to leave its overnight rate unchanged at 1.00%, in line with expectations.  BOC Governor Mark Carney pointed at the strong Canadian dollar as a disinflationary force that will help keep rising prices subdued, saying “the persistent strength of the Canadian dollar could create even greater headwinds for the Canadian economy.”  It is undeniable that the Loonie has been very strong against the Greenback, the currency of our largest trading partner, however relative to our other trading partners it is more of a mixed bag. 

Canada’s Trading Partners

Canadian Exports
Courtesy of Stats Canada

Canadian Imports
Courtesy of Stats Canada

As the charts above show, the U.S. dominates Canada’s international trade; however it has been consistently losing ground to other countries.  Keep in mind that the ‘All Other’ category is primarily China.

Canadian Dollar vs. Our Trading Partners

CAD/USD – US dollar
Courtesy of Bloomberg

CAD/EUR – Euro
Courtesy of Bloomberg

CAD/GBP – British pound
Courtesy of Bloomberg

CAD/JPY – Japanese yen
Courtesy of Bloomberg

CAD/AUD – Australian dollar
Courtesy of Bloomberg

CAD/CHF – Swiss franc
Courtesy of Bloomberg

-Jaime Macrae, CIM
Account Executive, Friedberg Mercantile Group
jmacrae@friedberg.ca

Monday, April 11, 2011

The Need for Corn Rationing - Apr 11th

The Need for Corn Rationing
April 11th, 2011


Corn has outperformed every other major commodity over the past month, rising over 16.5 percent, and beating even the headline dominating silver market.  This is no speculative bubble, but a manifestation of classic supply and demand.  As discussed in earlier posts (see Grain Outlook from March 22nd), corn demand continues to march higher due to increased ethanol production, as well as sporadic export demand from China.  This has created a very tight supply situation in the United States, where corn is the largest cash crop.

USDA Estimate of Corn Use (Left-axis) and Ending Stocks (Right-axis)
Courtesy of Bloomberg

The most recent USDA supply and demand estimate pegged corn use at a record 13.5 billion bushels, and ending stocks at a mere 675 million bushels.  Even this estimate may prove to be overly optimistic, as the pace of stock depletion races forward in the face of surging prices. 

The chart below shows the depletion of corn stock from January through March over the past couple of decades.  We can see that historically high price of corn has not discouraged usage, which ballooned to a new high, and increased 10.14 percent from the same period last year. 

Stock Depletion in First Quarter – USDA
Courtesy of Bloomberg

This helped push March 31st corn stocks to the lowest level in four years (see chart).

March 31st Corn Stocks – USDA 
Courtesy of Bloomberg

Should the pace of stock depletion continue at this pace, meaning a 10 percent increase over last year from April through September, the market will go into a deficit before the new crop is harvested.  Obviously this is a situation where high prices will be required in order to ration supply.  In order to have ending stocks meet the USDA’s estimate demand must shrink to 2 percent less that last year for the next six months. 

-Jaime Macrae, CIM
Account Executive, Friedberg Mercantile Group
jmacrae@friedberg.ca
Friday, April 8, 2011

European Demand Helping Heating Oil Higher - Apr 8

European Demand Helping Heating Oil Trade Higher
April 8th, 2011


Following last month’s devastating earthquake and ensuing tsunami in Japan, traders have been busy figuring out how it will affect commodity markets.  Energy traders have certainly found a profitable opportunity in heating oil. 

Lost Japanese Exports

The March 11th earthquake forced the closure of six refineries in Japan, with a combined refining capacity of 958,500 barrels per day.  Despite Japan’s reliance on foreign crude oil, its well-developed refinery infrastructure allowed it to export about 150,000 barrels of diesel and gasoil per day.  Due to the refinery outages however, exports have for all intents stopped.  This has helped Asian benchmark prices stage their longest rally since 1991.

Lost Libyan Crude

Libyan crude oil is of a very high quality, and is easily refined into diesel fuel, most of which is sold to Europe.  Unlike the U.S., where last year only 2 percent of new vehicles sold run on diesel, about 46 percent of new European vehicles use the fuel.  The reduction in supply has helped push the price of the fuel steadily higher, and the premium over the U.S. price is increasing as well.  On March 15th, the premium hit an interim high of $47.37 per tonne (about 7.35 barrels), compared to the average of $19.13 per tonne over the past year.  As a result, U.S. traders including JPMorgan, Morgan Stanley, and Shell have been ramping up their exports to Europe, helping to push prices higher here in North America.  In February, 11 tankers were sent to Europe, carrying 483,000 tonnes; March saw that volume nearly double to 20 tankers carrying about 800,000 tonnes. 

-Jaime Macrae, CIM
Account Executive, Friedberg Mercantile Group
jmacrae@friedberg.ca

Thursday, April 7, 2011

Plentiful Crude Oil and Rising Prices - Apr 7th

Plentiful Crude Oil and Rising Prices
April 7th, 2011


Reading the daily headlines about unrest in the Middle East, restricted if not frozen output from Libya, and a falling U.S. dollar (the currency in which most crude is traded), there isn’t much mystery as to why crude oil has been so strong.  Year-to-date, crude oil has risen almost 19 percent in the U.S.; overseas the Brent crude has gone up over 28 percent.  While this makes sense in light of recent geo-political developments, a closer look at the local supply situation raises some interesting questions.

Abundant Stockpiles

Energy traders pay close attention to the Department of Energy’s weekly survey of crude oil inventories in the United States.  When inventories decline, crude tends to go up as traders infer greater demand or less supply in the market, conversely when inventories rise, the price of crude usually falls.  Since 2008, this relationship has shown a strong negative correlation, averaging about -60%.  More recently, since the beginning of 2011, the relationship has reversed, and crude continues to rise despite swelling inventories.  The correlation between stockpiles and crude oil is now positive, at around 21%.  The chart below shows total U.S. crude inventories (excluding the Strategic Petroleum Reserves – SPR), overlaid against the benchmark WTI (West Texas Intermediary) crude oil futures traded in New York. 

Total U.S. Inventories and WTI Crude
Courtesy of Bloomberg

As you can see, they have tended to move in opposite direction, but both are now trending up.  Surely, crude oil is a global market, and is easily transported from one place to another via tankers and pipelines, so prices in one place tend to stay very close to those in another.  Though even that relationship has been breaking down of late…

Cushing, Oklahoma

As mentioned earlier, WTI crude futures traded in New York have served as the global benchmark for the price of crude oil.  When the news reports on changes in the oil market, this is the price they are referencing.  The other popular benchmark is the Brent crude futures traded in the UK.  Historically Brent crude has traded at a slight discount to WTI, reflecting the slightly lower quality of the crude oil (a discussion of crude types will be reserved for another day), and the price of cross-Atlantic transport.   Due in part to the contract specifications of the two futures contracts, a large divergence from the historical relationship has developed in the past few months.

WTI crude futures are physically delivered in Cushing, Oklahoma.  While most futures contracts are never physically delivered, the theoretical ability to take delivery of actual crude is the mechanism by which futures contracts are able to reflect the true market price of the underlying commodity.  The Department of Energy began tracking crude stored in Cushing in 2004, as supplies in this particular hub are readily available to be delivered against the WTI crude futures.  As we can see in the chart below, inventories have been rising steadily and currently sit at the highest level since the DOE began keeping records. 

Crude Inventories in Cushing, Oklahoma
Courtesy of Bloomberg

As a result of the rising demand for storage space in Cushing, the cost of stockpiling oil has risen dramatically, depressing the price of WTI crude as compared to other global benchmarks.  Looking at the spread between WTI crude oil and Brent crude oil, which is sourced from the North Sea (located between Great Britain and Scandinavia), we see a large divergence from historical norms.

Brent-WTI Crude Spread
Courtesy of Bloomberg

What this all means for the future of crude price is anything but clear, but it does reveal the difference between perception and reality.  While there are a lot of market moving headlines and bullish sentiment, the reality is crude oil is plentiful, at least in the U.S., which is the world’s largest consumer. 

-Jaime Macrae, CIM
Account Executive, Friedberg Mercantile Group
jmacrae@friedberg.ca

Wednesday, April 6, 2011

Cotton - Apr 6th

Cotton
April 6th, 2011


Extreme Volatility

Cotton has been making headlines for months, setting successive new highs over and over again.  So far this year the fiber has risen almost 45%, and over the past 12 months it is up almost 170%.  Even more impressive (or troubling, depending on your point of view), is the volatility in the futures market.  Over the past 2 months, cotton has closed either locked limit-up or limit-down 19 times, that is a shocking 44% of the time. 

*For those not familiar with the futures markets, the exchanges sometimes set limits as to how much the price is allowed to change on any given day, in the case of cotton the limit is $0.07 per pound.  Considering that the average price over the past decade was around $0.60 per pound, historically that would have been a huge move, now it is simply the norm.*

Front-month Cotton (ICE)
Courtesy of Bloomberg

Very Tight Fundamentals

Unlike many other hyperbolic rallies, the rise in cotton prices has not been driven by excessive speculation, but in fact very compelling fundamentals.  The United States has long been the world’s top exporter, a title ceded to India in 2009/2010, but which it is likely to reclaim this coming season.  Export demand, driven largely by China, has absorbed almost all of the U.S.’s production from last season, leaving supplies at extremely low levels. 

U.S. Cotton Exports & Exports as % of Production
Courtesy of Bloomberg

As you can see, recent exports represented almost all the last season’s production, forcing domestic users of cotton to consume stockpiles.  As a result the carryover is very low (see chart).

U.S. Ending Stocks – Cotton
Courtesy of Bloomberg

The high price has encouraged farmers to plant more cotton this year, with the USDA estimate currently pegged at 12.6 million acres.  This is up from last year, though below what most traders were expecting.  This has been supportive of new crop futures (December contract), which in early March were trading at an $0.89 discount to the cash market, and is now only $0.66 below the spot price.

Seeding has now begun, and is slightly ahead of last year’s pace with 6% planted.  However, Texas is the largest cotton producer, accounting for about half of all U.S. production.  It is also experiencing a very serious drought.  Though this is not a huge concern for the cotton crop at this time, but if the situation persists for another month it could damage the crop and bring further tightness to the market.

-Jaime Macrae, CIM
Account Executive, Friedberg Mercantile Group
jmacrae@friedberg.ca